Making an API with Datasette and Glitch
Our end goal - or one of our end goals - is to get the material out of the museum, out of the printed page, and online where someone can query it, filter it, extract items of interest, mash it together with other data, or something else entirely that we haven’t thought of yet. That means, we need to build an API. If you go to the Canada Science and Technology Museum open data portal, you’ll see that they’ve made data available, but it’s one big dump of data. We can download it, but then it’s on our own machines and it is difficult to work with. If they update the data, we’ll have to re-download it, and re-do all of our cleaning or filtering. If there was an API, and we were working with data from the API, we’d get the changes in data as soon as they updated.
So let’s build our own API.
Grab some data
First thing we’re going to do is grab some data that already exists in the world. (Eventually, we’ll use your data!)
- Get data from the CSTM open data portal. (Or download here).
- Open the csv in sublime text or another text editor.
- How is the data organized? Notice that the fields are delimited using the | (aka, ‘the pipe’) character. Close the file.
- Start up Excel. Create a new document, then go to file > import and select ‘csv’. Select the CSTM csv file.
- Select ‘delimited’ when it asks you how the fields should be determined.
- Select the ‘other’ option, and type a | in there so Excel knows how to import. Click ok.
- Now go to ‘save as’ and select ‘csv’. Give the file a new name so you don’t do anything to the original file, like ‘cstm-new.csv’.
Why did we do this? By importing and then saving the data, we transformed the data slightly. The act of ‘saving as’ wrapped quotation marks around all of the text in each field in the data - otherwise, a comma in a written description, or a semi-colon, or another punctuation mark might be read as a field marker and so break our data. Importing and saving as also transformed all of the pipes into commas so that the only commas in the data now are column (field) delimiters.
Datasette
A tool for exploring and publishing data
Datasette is a tool for exploring and publishing data. It helps people take data of any shape or size and publish that as an interactive, explorable website and accompanying API.
Datasette is aimed at data journalists, museum curators, archivists, local governments and anyone else who has data that they wish to share with the world. It is part of a wider ecosystem of tools and plugins dedicated to making working with structured data as productive as possible.
<br> <span class="author">— Datasette</span>
Publishing and exploring data: check! That’s exactly what we want.
Now, Datasette can be installed on your own machine, which can be fiddly and requires a fair degree of fluency with working at the command prompt or in the terminal. (If you did install it locally, you can also do a lot of customization, but that’s a task for some other day). We’re not going to do that today, because a kind soul, Simon Willison, made a template for us to use on the collaborative live-coding website Glitch. This template contains everything within it that we need to get a table of data online via an API and website where we can also manually query it.
- Make sure you’re logged into Github; this is not strictly speaking necessary, but it will make finding your work again later much easier.
- Click on this remix link
- This takes you to the code page for the datasette template; in the top right hand side of the screen is a login button; select that, and select github.
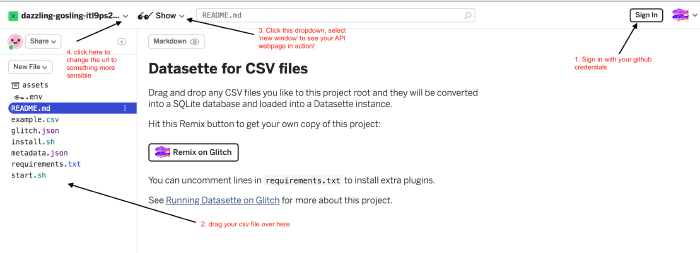
The coding window for Glitch - You should now be back at the datasette template, and be logged in. The next time you go to glitch.com and login, your datasette template will be listed.
- Drag and drop the ‘cstm-new.csv’ file onto the list of files on the left hand side of the glitch coding window. It will upload your data into the template. Wait until everything calms down.
- Where it says ‘show’ at the top of the window (with the sunglasses icon), hit the drop-down menu and select ‘new window’
Ta da! Your data is now live, on the web, as an API.
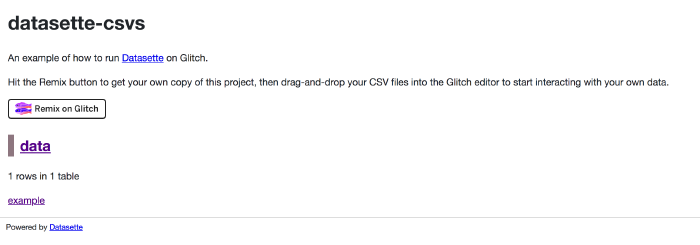
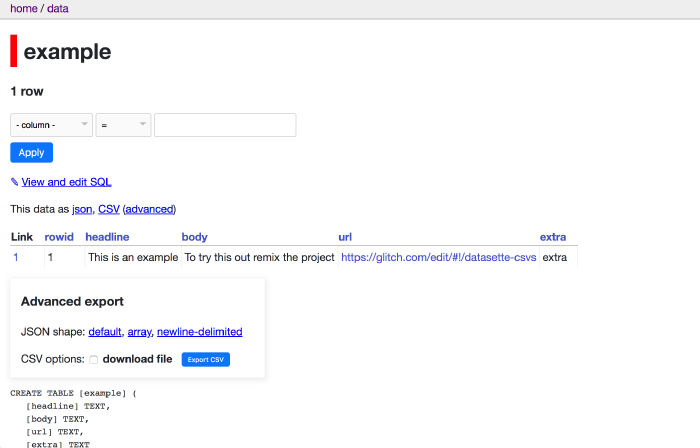
Now, a good API also has to be documented properly, so that people know what the different fields are and how to get the data out in the format that they want (eg, do you spot how to get the data out as .json or .csv by adding something to the URL?). In our case, you’d want to draw on the data dictionary for the CSTM.
Here’s and example of the documentation for the Aukland Museum. If you go to their ‘insights’ page you’ll see some data visualizations of their collection, obtained by querying their API.
Now, in case something went wrong, here is my version of the CSTM data in datasette. Try building a query from the drop-down menus that retrieves every object made in Quebec before 1940.
Going further: writing some code to interact with our API
Every field can be queried, and complex queries can be written, using the various facets and the query builder on our webpage. But we can also do that by writing the query directly in the URL; once we have the url, we can write scripts that for instance download just the information we want.
If you go to this github repo of mine you’ll see a button that says ‘launch binder’. If you hit that button, the Binder service will create a virtual computer for you that can run our code (this saves you from having to install a bunch of things on your own computer). Don’t do that yet.
Instead, just take a look at this static version of the ‘retrieving data from our datasette api’ notebook.
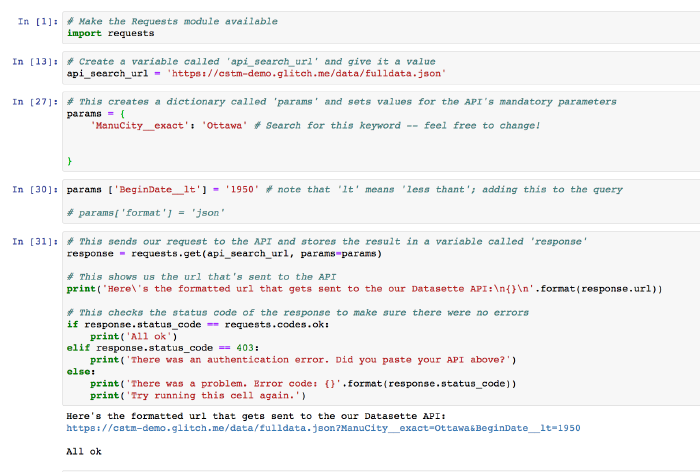
The first cell tells the computer that we want to use a little package of python code called ‘requests’ that makes it easier to work with webpages.
The next cell creates a variable called api_search_url that has the full path to our API plus the little bit that says, ‘hey, give us the results as json please’.
The next cell creates a parameter for our search, and uses a key:value pair that should be fairly clear - that is, we tell it what field we’re interested in, and what text we want to find there.
In the fourth cell, we add some more parameters that we want to use to narrow everything down.
The fifth cell is a check to make sure that our code builds the query url correctly and then tests it to see if our API returns an ‘ok’ signal.
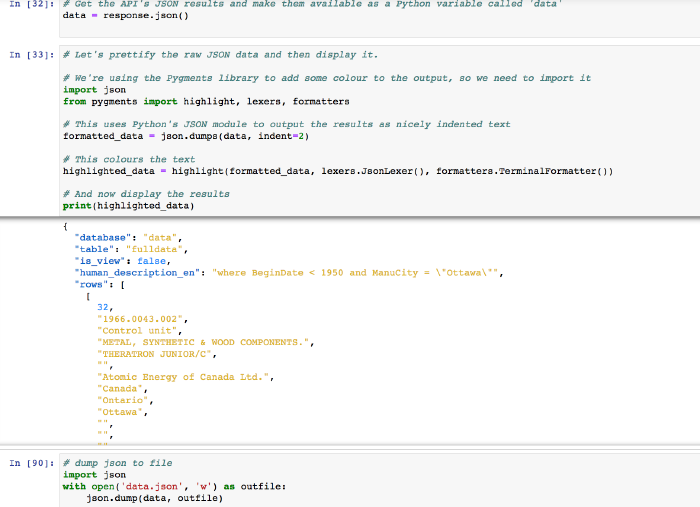
Then, the cell that says data = respons.json() does the work of going and getting the results; the next cell displays the results for us, and the final cell writes it all to file!
Now, if you hit the ‘launch binder’ button, you can load up the notebook and run the code for yourself, and experiment with changing up the parameters.
